
Arc Virtual Cell Challenge part 2: What the Leaderboard Collapse Reveals About Model Evaluation
Some participants have already found a way to hack the score, exposing fundamental flaws in how bio-foundation models are evaluated.

The Arc Virtual Challenge is coming to an end, with the deadline in a mid November 2025.
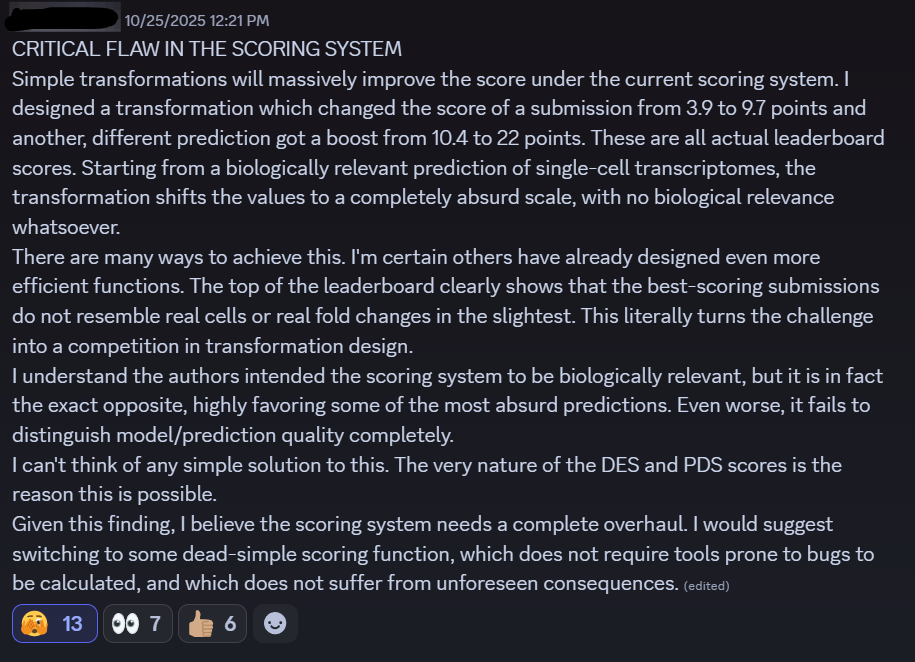
However, the challenge’s Discord forums are in turmoil. Some participants have discovered a trick to get to the top of the leaderboard: by simply applying certain data transformations - such as increasing variance or transforming the counts to log1p - they can multiply their score by multiple factors.
In some cases, applying these transformations to random data returns better scores than using the top models.
What is happening, and why?
As mentioned in the previous article, the objective of the Arc Virtual Cell Challenge is to predict the effect of gene perturbations in the H1 hESC cell lines.
Participants need to provide a matrix of gene expression for all 18k genes in the model, for a number of cells containing the simulated perturbations, as well as some controls.
One participant recently posted in the Discord channel of the challenge, describing how they were able to increase their leaderboard scores by applying specific data transformations. Other participants replied that they discovered the same issue.
How are the predictions evaluated in the challenge?
To understand the issue, let’s go through the three criteria used to score the submissions in the challenge.
MAE
The first criteria is the Mean Absolute Error over the gene expression, across all 18k genes in the matrix, by sample.
The predicted gene expression values are compared to the true values, and the average error is calculated.
Differential Expression
This checks whether the model can predict which genes are up or down regulated in each perturbation
Participants are asked to submit a number of “control cells”, without pertubations, together with the predictions. The DE is computed by comparing these controls against the pertubations.
Perturbation Discrimination score (PDS)
The PDS measures how well the model distinguishes one perturbation from the other.
If two gene knockouts have different transcriptomics signatures, the model should reproduce that difference.
This metrics was originally proposed in the Pertubench paper, but the ARC organizers have used a slightly different implementation.
Where is the flaw?
One of the main flow in these criteria is in the MAE.
Calculating the MAE across all 18,000 genes in the human genome introduce a huge amount of random noise - especially from genes that are weakly or inconsistently expressed. These genes contribute very little biological signal but still add variability to the score.
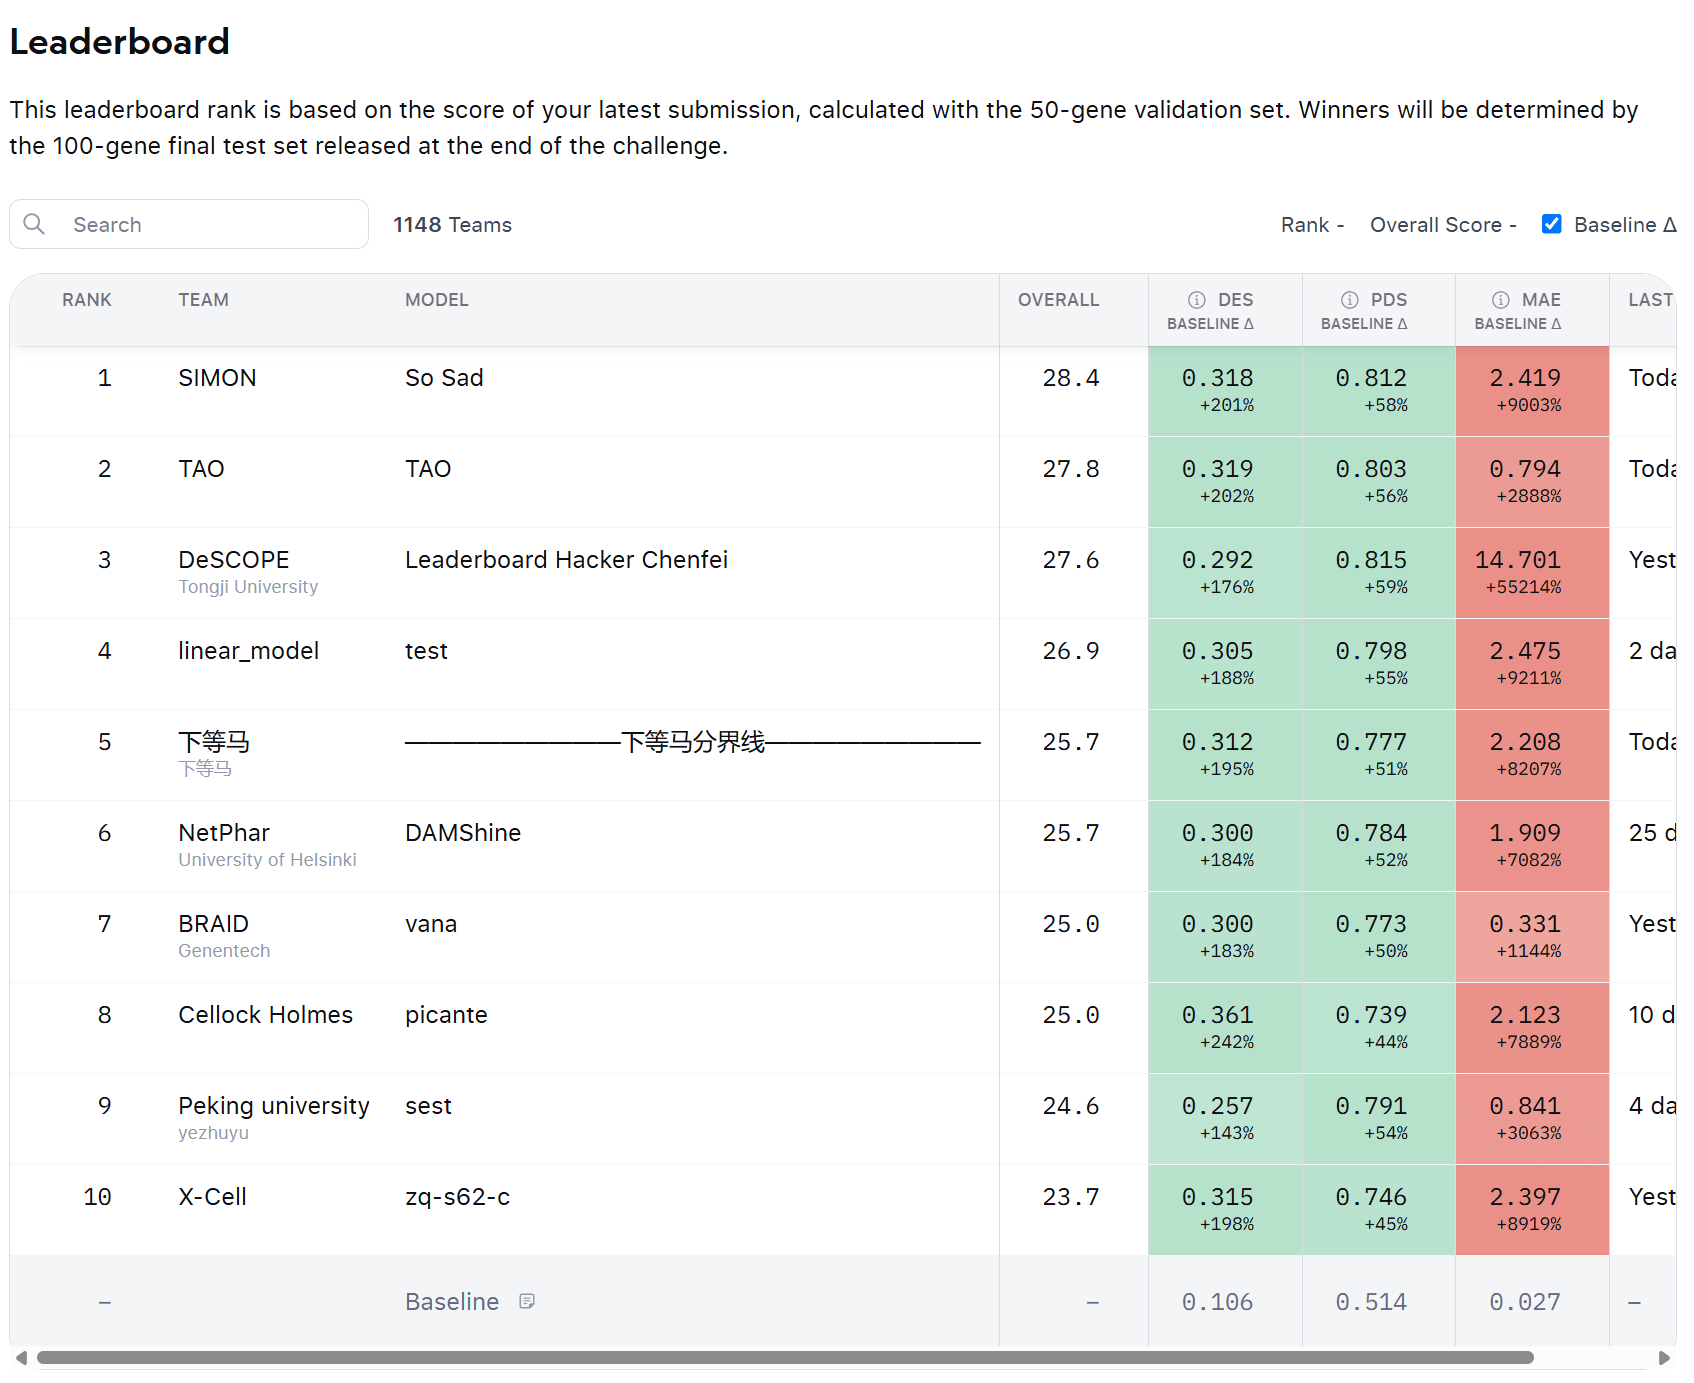
If you look at the leaderboard of the challenge, you’ll notice that very few predictions achieve a MAE score above the baseline. It is just too difficult - there is too much noise.
To compensate, the organizers decided to cap the penalty for a poor MAE score at zero. In other words, if your predictions perform worse than the baseline — whether by a small margin or by a massive one — the penalty doesn’t increase. It’s fixed.
Why is fixing the penalty for MAE an issue?
Normally, the MAE would be a kind of counterweight to the other two metrics (the Differential Expression Score and the Perturbation Discrimination Score). If you apply an extreme data transformation - for example, increasing variance or using a log transformation - it might artificially boost your DE and PDS scores by exaggerating gene-level differences.
However, these same transformations should also worsen your MAE, since your predicted expression values become less numerically accurate. Under a fair system, that worsening MAE would cancel out the artificial improvement in DE and PDS, keeping the leaderboard balanced.
But with the MAE penalty capped at zero, that natural correction disappears. Models can now inflate variance, distort distributions, or even submit nearly random predictions - and still achieve excellent DE and PDS scores without being penalized for inaccuracy.
The Fundamentally difficult problem of evaluating Foundation models
To me, this discussion on the challenges of evaluating a Foundation model is more interesting than the challenge itself. #
Recent publications have raised doubts over the utility of these big bio-foundation models. For example, Zedzierksa 2025 et al showed how scGPT, GeneFormer and other models are outperformed by simpler models, even by a simple regression.
But, what does it mean that these models are outperformed? What are we measuring, exactly? And what is the right metric to look at?
Following the discussion on the Arc Challenge’s discord forum, some participants have created another group of discussion, to further elaborate and propose new metrics. This is great, because it includes people from different backgrounds - biologists, machine learning scientists, bioinformaticians - each providing different points of view on this problem of evaluating foundation models.
The group is preparing a statement that will provide many more details on this issue, and provide possible solutions. The MAE capping is just one of the problems to fix. I’ll keep you posted on this blog - please subscribe to receive a notification on the next posts :-).
Thank you for writing this up!! Minor comment though -- it's Kedzierska, not Zedzierska.
Great post